Early Bukowski is so weird and pretentious and sad.
Far from the image of Bukowski recognized in certain b-tier art consumer circles today: the tired but ultimately complacent and entertainingly vulgar, foul-mouthed, grotesuqe, post-sexual old fuck.
It is a frustrated and resentful young Buk, aggresively naive, lobbing trite and tired old observations about consumerism and superficiality at a society he sees himself as somehow, not belonging, if not so much as superior to. Criticizing, unsubtly justifying himself and his obvious misery instead of trying to merely 'convey' and 'express'
We see a man utterly, yet understandably, incapable of conceiving of a reader who is genuinely curious to read about who he is, what he sees and says and does, to get to know him as opposed to his thoughts and opinions and, strangely, words.
A sort of like, archetypal adolescent lamentation, representative of types that he would, himself, eventually come to describe as: 'writing about life as if they had a real angle on it.'
He, to put it rather mildly, bores. If his trick is being such a disastrous mess that you can not, for the life of you, look away, then clearly he isn't there yet, as he writes.
The aspiration to come out on top is still there, and it's so familiarly tedious and dull, another ambitious striver making ostensibly pointed remarks on the sourness of the proverbial grapes. He loathes and resents us for having and enjoying and taking for grant all these things which he will, eventually, come to confess a profound pain of deprivation and unmet need for. The deadthly-tired old toad now brooding, ruminating, reflecting on all those things he never had, will never have. The deep and festering wounds of rejection, isolation and pain ever wide open, never healed, nor closed or scarred. A Bukowski who, in due time, wearing his collosal gash on the proverbial sleeve, would gather small and rowdy crowds in small rooms translucent with smoke and loud with jeering and swear words, crowds that never missed a good laugh at a bodily-function type joke but would often seem to fail to perceive the endings of his rather more serious pieces and, like, forget to applaud, or respond, the way that failing to add the appropriate inflection at the end of a sentence can leave your interlocutor like, hanging, waiting for you to go on
Because, still, at that point, we see a man, who, like so many of us, still hopes and strives, kicks back and wants, grasps for it, frustrated and sad.
ok so. a while back i'm chasing HTTP GETs that time out. over loopback. big server, tons of headroom, no network in the path, just curl talking to nginx on the same goddamn box. this should take, what, a millisecond. it was hitting my 10s timeout instead. not every request. that's the part that gets you.
first thing you do, obviously, is check the error log. nothing. access log? every line looks fine. syslog? nothing interesting. dmesg? clean. no OOM, no kernel weirdness, the box isn't even breaking a sweat. so now you're nowhere, holding a server that times out for no reason it'll admit to.
so i did the dumbest possible thing. wrote a little bash loop that just fires GETs forever and prints how many it's done since the last timeout. and then i sat there. watching logs scroll in another terminal. waiting to see if anything so much as twitched in syslog at the exact moment a request died.
if i have ever felt more like a monkey, i genuinely cannot tell you when.
and then it occurs to me, oh, there's a way to actually tie curl's timeouts to nginx's log lines. the server was already logging the User-Agent. so instead of printing the iteration number to my own terminal where it does nothing, i started shoving it into the User-Agent of every request:
now a timeout from curl comes with a unique number i can grep for. so i wait. one fires. grab the iteration off curl's output. grep the access log.
status: 200.
ok. fine. probably fat-fingered the grep. wait for another one. grep.
200.
every single timed-out request, logged 200. every. single. one. the server is sitting there convinced it served a request the client never got a byte of.
so i stopped, and stared into the abyss of the terminal for a while.
once you stop staring it's not even that exotic. nginx logs a request when it decides the request is done, and "done", to nginx, means: i finished shoving the response into the kernel send buffer. that's the whole bar. it does not mean the client got anything. it does not mean the connection closed clean. there is no FIN-ACK anywhere in this picture. from nginx's point of view the thing ended the instant the last writev / sendfile / SSL_write came back with nothing left to send. status 200, bytes_sent whatever, write the line, move on, next.
whatever happens on the wire after that is somebody else's problem. and on loopback, apparently, somebody else had a real problem.
i think people read an access log like it's the receipt at a restaurant. 200, you got your food, enjoy. but it's not the receipt. it's the kitchen ticket. the kitchen is telling you the food went out. whether it ever landed on your table is a completely different question, and the access log does not know the answer and is never going to.
once i actually got this i stopped harassing nginx and went to look at the TCP state, which is, of course, where the answer was always going to be. send buffer full. nothing getting acked from the far end of loopback (yeah, loopback can do that, its own rabbit hole, its own bad evening). curl eventually gives up. nginx never even notices, because nginx left the building ages ago.
i'd love to tell you the next chapter, what was actually broken down in the kernel, but that's a different post and i'm honestly still not fully sure. this one's simpler. the point of this one is: stop trusting the access log.
if your access log says 200 and your client says it timed out, the client is right. always. the access log is telling you what the server meant to do. it is not telling you what happened to the bytes.
couple things i do differently now:
i keep $bytes_sent and $request_length in the log format and actually look at them when timeouts get weird. bytes_sent equals the full content length? the server thinks it did its job. short? ok, now that's a clue.
for loopback / same-host stuff especially, i correlate by something i control, a request id, the User-Agent trick, whatever, never by timestamp. timestamps are too fat, and if you correlate by timestamp under load you will talk yourself into believing all kinds of things that simply did not happen.
and when someone tells me "but the logs say 200", i no longer hear that as evidence of anything except that nginx finished writing.
the lesson isn't really about nginx. nginx is doing the exact thing it says on the tin. the lesson is that every log line is fired by some specific line of code, some specific event, and if you don't know which event, you do not know what the line means. miss that and you end up where i was, 11pm, staring at a terminal, asking a server that swears it succeeded why it's also the thing timing out my client.
hot take, and almost nobody frames it this way: HTTP/3 is one of the cleanest dev-vs-ops fights i can think of, and everyone insists on talking about anything else. head-of-line blocking. 0-RTT. cool. sure. meanwhile the actual thing QUIC did, organizationally, is the transport layer got up, walked out of the kernel, and moved into your application binary — and the second it did that, it walked out of ops' hands and straight into the developers' lap.
for like thirty years the deal was simple and kind of beautiful. devs write the app. ops own the network. TCP lives in the kernel. congestion control, retransmits, backoff, RTO, all of it, somebody else's problem. you tune a few sysctls, you bump the kernel when you want a new congestion controller, and the same one TCP stack serves every process on the box. one place to watch it. one place to fix it. ss, tcpdump, netstat, the /proc/net/* counters, nstat, a whole ecosystem of tools that all quietly assume the kernel is the source of truth about your connections. and it was.
QUIC throws the whole contract in the bin. it runs over UDP, and the entire reliable-transport state machine — streams, flow control, congestion control, loss detection, retransmits, acks, the lot — lives up in userspace, inside whatever library the app happened to link against. nginx-quic, ngtcp2, quiche, msquic, lsquic, the Go stdlib one, chromium's one. these are not the same code. they do not behave the same under loss. they do not expose the same counters. there is no ss for QUIC. the kernel sees a stream of UDP datagrams and shrugs at you.
that's a transfer of responsibility wearing a protocol upgrade as a disguise.
concretely: something goes wrong at the transport layer in a QUIC deployment, and the reflex ops answer, "let me check the kernel, the NIC, the sysctls", gets you basically nowhere. the behaviour you care about is now a function of which library your devs picked, which version they pinned, what congestion controller it happens to implement, and what, if anything, it felt like logging. dev team links one library, the CDN out front links another, and congrats, you've got two different transports that merely agree to interoperate on the wire. every property you used to get for free, one stack, kernel-tuned, observable with normal tools, gone. and getting it back is a development project now, not an ops ticket.
this is also, i think, why a lot of shops quietly hate operating QUIC even while they love serving it. the exact thing that made TCP boring — that it was somebody else's code, in somebody else's address space, watchable with somebody else's tools — is precisely the thing QUIC hands back to you. what you get in exchange is the ability to ship transport changes without waiting on a kernel release, which is incredible if you are Google and miserable if you're four people in an ops channel trying to work out why p99 went sideways on a Tuesday.
none of this is me arguing against QUIC. i serve it, it's fine, it's good even. it's me saying QUIC isn't just a protocol change, it's an org-chart change — and the people who end up debugging it at 3am are, almost always, not the people who got to vote for it.
proxy_cache_lock and the lying upstream_response_time log variable
if your nginx alerting hangs off $upstream_response_time because somebody once told you it's "how long the request took to be served", you are quietly underreporting a whole class of incident. specifically: anything where requests pile up behind proxy_cache_lock.
the thing i had to learn the slow way: time spent waiting on the cache lock lands in $request_time but not in $upstream_response_time. they're not the same metric and they don't differ by some constant you can subtract back out. under contention they drift apart by seconds, and the one that feels like the right thing to alert on is exactly the one hiding the problem.
proxy_cache_lock exists to coalesce parallel cache-fill requests. ten clients ask for the same uncached object at once, you don't want ten fetches hammering your origin, you want one fetch and nine followers waiting on the result. the followers, while they wait, are blocked. that wait is real wall time. it's user-visible. it's in $request_time. it is not in $upstream_response_time, because $upstream_response_time measures the upstream call and nothing else: connect plus send plus read. time the request spent pinned to a lock isn't part of that, and nginx is not going to go back and add it in for your convenience.
Repro
single-worker nginx, cache-locked location, a lua origin that sleeps before it answers. same cache key for every request so the lock is shared.
drive it with five parallel curl calls at the same URL.
Result 1: followers time out the lock
origin sleeps 3s, proxy_cache_lock_timeout 2s. the leader goes upstream. the four followers sit on the lock for 2s, the lock times out (the leader still isn't done, it finishes at 3s), and now each follower goes upstream on its own.
for each follower, rt - urt = 2.0s exactly. that's the lock wait, right there. urt reflects only the upstream call, identical for all five.
if your dashboard graphs urt p99, this incident is invisible. every request "took 3 seconds upstream", which is technically true and operationally useless. the clients waited 5.
Result 2: staircase via uncacheable origin
now make the origin uncacheable. same 3s sleep, but the response sets Cache-Control: no-store. push the lock timeout high enough that it never fires (proxy_cache_lock_timeout 60s). the cache never populates, so no upstream call ever satisfies a follower, the lock just keeps getting handed down the line.
urt stays flat at 3s. rt climbs by the cumulative lock wait. alert on the upstream metric and the box looks perfectly healthy: every upstream call takes 3 seconds, which is what it always takes. meanwhile the fifth client waited fifteen.
the reason this trips people up, i think, is that "upstream response time" sounds like the longest, most far-away thing nginx waits on, and intuitively the longest thing should dominate the latency. but nginx isn't narrating, it's bookkeeping. $upstream_response_time is "time spent talking to the upstream server", measured from inside the connect/send/read calls and nowhere else. time spent waiting on internal coordination, locks, queues, anything that isn't the upstream socket, doesn't show up. the name oversells it.
the fix is boring: alert on $request_time if you want to know what the client actually felt. keep $upstream_response_time in the log too, so you can compute rt - urt and watch which component is moving. high rt with a flat urt across a pile of parallel requests for the same key is the fingerprint of cache-lock contention, and basically nothing else produces that exact shape.
same lesson as the access-log post, slightly different shape: every metric is the answer to one specific question. don't know the question, you don't know what you're looking at.
nobody reaches for parallel requests. watch any engineer hit a flaky, intermittent problem — ops, nginx, backend, it doesn't matter — and they reach for curl in a loop. sequential, every time. i have never once seen anyone fire requests in parallel unless they were already desperate and out of other ideas. so you get a room full of people running curls one after another, some passing and some failing, and not one of them can say why. the answer is almost always that two of the requests happened to overlap in time — accidental parallelism — and that overlap is the whole bug. fire the same requests in parallel on purpose and the failure reproduces on the first try. the intuition about concurrency is so bad that the one tool which would catch the bug immediately is the tool nobody thinks to pick up.
and when you do finally reach for it, it bites you a second time: "parallel" keeps quietly collapsing back into "serial." you fire off N requests at once, feel clever, and a layer down they line up single file and you never see it. so the rest of this is less a tutorial than a list of where i keep getting bitten, and the flags that make it honest.
simplest way to send the same request many times, at once:
-Z (--parallel) means "do these concurrently instead of one after another." list the same URL N times and they go out together. i keep a little wrapper for exactly this — it repeats whatever URL you hand it seven times and prints each one's time, local port and speed, so you can watch them overlap.
now the part that bites. plain --parallel, given the chance, reuses one connection for all of them — so your seven "parallel" requests get multiplexed down a single socket and quietly take turns. parallel on paper, serial on the wire. the fix is --parallel-immediate: open a fresh connection for each, right away, instead of waiting to reuse one. the note i once left myself:
--parallel              # same connection, can serialize on you
--parallel-immediate    # different connections, actually concurrent
the tell is local_port in the output: same port across all of them means they shared a connection; different ports means they really went out in parallel.
the lookalike that is NOT parallel: --next.
curl https://a/ --next https://b/
--next does chain several requests into one curl process, but it runs them one after another. serial batching that reads like the real thing. if you wanted them at the same time you wanted -Z, not --next.
and if you'd rather curl not drive the parallelism at all — i gave GNU parallel an honest couple of tries and it drove me crazy, the quoting especially — two boring things that always work:
# xargs, 8 at a time
printf '%s\n' "${urls[@]}" | xargs -P 8 -I{} curl -sS {} -o /dev/null

# or just background them and wait
for u in "${urls[@]}"; do curl -sS "$u" -o /dev/null & done; wait
that's the whole toolkit. the flags are easy. the hard part is remembering that every "in parallel" you write has at least three places it can secretly become "in sequence" — a shared connection, a shared lock, one worker doing one thing at a time — and your intuition will not warn you about any of them. you just have to go look.
code agents will tell you they wrote a thorough test. they reach for words like "comprehensive" and "exercises the happy path and edge cases". they're guessing. coverage data is the one thing in the room that isn't guessing.
for an nginx fork i work on i keep a Claude Code skill called /coverage-audit. it rebuilds with gcov instrumentation, wipes stale .gcda, runs a named pytest target, then reads the .gcov output for the source files the test touched. for every uncovered line it picks a bucket:
defensive guard — NULL check on state that can't legitimately be violated
allocation failure — line after *alloc returning NULL
init-time failure — ngx_array_push failing in postconfig
debug-only — inside #if (NGX_DEBUG)
conditional compilation — #if 0
configuration variant — directive branch the test config didn't toggle
input variant — TLS version / cipher / header presence the test didn't try
real branch — none of the above
the first five aren't worth chasing. mock them into green and all you've bought is a bigger number and zero extra confidence. the last three are the real gaps. write a test that hits those.
the skill spits out something like:
foo.c: 90.62% of 192 lines

Testable:
  - foo.c:175 — `return NGX_DECLINED` when feature off
    → add a test with `feature off;` in the server block.
  - foo.c:93-94, 134-135 — `not_found = 1; return NGX_OK`
    → hit by plain-HTTP listener; add a non-SSL test.

Not worth chasing:
  - Allocation failure: foo.c:393, 408, 422, 435
  - Defensive guard:   foo.c:241, 374, 454

Verdict: test exercises legitimate input combinations cleanly;
gaps are real branches plus fault-injection paths.
run the audit in a different Claude session than the one that wrote the test. the auditor needs a different context, the .gcov files and the source, and it shouldn't be the same agent quietly invested in defending the thing it just wrote. two sessions, one window each. the audit hands you a punch list, the implementer works through it. same reason you don't let it mark its own homework.
second discipline: review the commit graph, not just the files. agents pile changes into whichever commit they currently care about. earlier today my implementer squashed three test commits into one, fine, but it also dragged a Dockerfile change and a CI image-tag bump into the test commit, because those had been bundled with one of the tests at some point. wrong home. they belonged in the earlier base-image commit. the fix:
an agent will run that whole sequence without a stumble the moment you tell it "the Dockerfile hunks belong in commit X". it will not get there on its own. where a change belongs is a human judgment. mechanically rewriting the graph to put it there is the agent's actual strength.
the pattern: agents produce, gcov audits, humans curate the graph.
tshark said "secrets are not available". the secrets were right there.
this site runs a JA4 module in nginx. hit /ja34 and it reflects back the fingerprint nginx computed for your TLS/QUIC handshake, ciphers, extensions, ALPN, the lot, plus a pile of $ssl_* variables. JA4 fingerprints how a client says hello, and it's only worth anything if it's correct. "looks plausible" is not correct. a fingerprint nobody can independently check is just a string the server made up.
so the question that actually matters: is the JA4 my nginx emits the same JA4 a known-good implementation would compute from the exact same bytes on the wire? you need a second opinion from something that didn't write the first one. Wireshark has had a JA4 implementation for a while, and it derives it from the raw ClientHello, completely independent of nginx. if nginx and Wireshark agree about the same handshake, i believe the number. that's the whole experiment: capture the handshake, decrypt it, read off Wireshark's JA4, compare.
the wrinkle: this is HTTP/3. the handshake i want to look at is a TLS 1.3 ClientHello riding inside QUIC CRYPTO frames, and QUIC encrypts its handshake. (remember the earlier post about QUIC dragging the transport into userspace? same bill, now due: there's no plaintext handshake left to sniff.) to see it i need the TLS secrets. curl writes them if you set SSLKEYLOGFILE, and tshark reads them via -o tls.keylog_file:… and derives the QUIC keys off them. standard stuff.
the QUIC Initial packets decrypted fine. they always will: their keys come deterministically off the Destination Connection ID, no secrets needed. but every Handshake and 1-RTT packet after that handed me:
[Expert Info (Warning/Decryption): Failed to create decryption
 context: Secrets are not available]
"secrets are not available." fine. except i'd just cat'd the keylog and the secrets were sitting right goddamn there: CLIENT_HANDSHAKE_TRAFFIC_SECRET, SERVER_HANDSHAKE_TRAFFIC_SECRET, CLIENT_TRAFFIC_SECRET_0, the works, keyed by the same client random as the ClientHello in the capture. the secrets were not unavailable. they were on disk, in the exact file i'd pointed tshark at, correct.
first theory: a race. live capture dissects packets as they land; curl only writes each secret once it derives it mid-handshake. so maybe tshark went looking for the handshake key, didn't find it yet, cached the miss, and never went back once curl finished writing. plausible. the standard fix is to not decrypt live at all: capture to a file, let the handshake finish and the keylog fully populate, then dissect the file.
$ tshark -i wlp44s0 -f 'host 162.19.246.242 and udp port 443' \
         -w /tmp/quic.pcapng
  # ...curl --http3-only https://pwnrzclb.net/ja34 in another shell...
$ tshark -r /tmp/quic.pcapng -o tls.keylog_file:$SSLKEYLOGFILE -V
same failure. identical. so it was never a race: the secrets were complete and on disk before this second tshark even started, and it still told me they weren't available. when the obvious explanation is wrong, stop theorising about the application and go ask the kernel what actually happened.
there it is. this box runs a recent Ubuntu, and recent Ubuntu ships an enforcing AppArmor profile for tshark (Canonical added it in 2024, part of the unprivileged-userns-restrictions push). the profile pins tshark to a tight allowlist: its own binary, the Wireshark data dir, a tmp area, /proc/self/fd. reading some arbitrary file under $HOME is not on it. the open() on my keylog returned EACCES before tshark read a single byte of it.
and here's the part that belongs in this blog specifically: tshark took a permission-denied on the keylog and reported it to me as "secrets are not available". those are not the same thing. one means "this process cannot open the file you gave me". the other means "the keys for this connection aren't in the material i loaded". tshark collapsed the first into the second, and in doing so sent me chasing a race condition that never existed. same disease as the access log that says 200 on a timeout, same disease as $upstream_response_time sitting flat while the client waits: the tool answers a question you didn't ask and lets you assume it answered yours. the Can't open your preferences file warning tshark prints on startup was this same denial, and i'd been filing it under "harmless noise" for months.
the fix is a local override. the shipped profile include if existss one, exactly so you don't have to touch the packaged file:
(if you go this way: capturing without sudo needs you in the wireshark group, and a shell that predates you being added to it won't have the group, so sg wireshark -c '…' or a fresh login. that one at least fails honestly.)
override in place, re-dissect. now the 1-RTT stream decrypts, and there in plaintext is the request that kicked the whole thing off:
and what nginx had independently reported for that exact connection at /ja34:
ja4: q13d0311h3_55b375c5d22e_a11bc413b5d6
byte-for-byte identical. that's the whole point of the exercise. decoded, q13d0311h3 says: QUIC transport, TLS 1.3, SNI is a domain name, 3 cipher suites, 11 extensions, first ALPN h3. then 55b375c5d22e is the truncated hash of the sorted cipher list, and a11bc413b5d6 the hash of the sorted extension and signature-algorithm list. two implementations that share no code looked at the same ClientHello and spat out the same twelve hex digits on each side. the implementation is correct, and now i can say that instead of hoping it.
one useful discrepancy fell out of it. the ja3_string nginx emits and the one Wireshark emits do not match. not because either is wrong: nginx hands back the extension list sorted (0-10-13-16-...-57) while Wireshark keeps wire order (57-10-22-23-...-16). classic JA3 is order-sensitive by design, so a sorted "JA3" hashes differently from a canonical one. JA4 sorts ciphers and extensions as part of its spec, which is exactly why the JA4 agreed while the JA3 didn't. lesson rhymes with every other post here: two fingerprints "matching" only means something once you know precisely what each side canonicalises before it hashes. compare the wrong normal forms and you either miss a real difference or invent one that was never there.
the fingerprint was always right. the keylog was always complete. the only thing ever broken was a tool describing a permission error as a cryptographic one, and me believing the description instead of checking it.
the dotfiles problem, except the files learn things
Claude Code keeps its state in ~/.claude. agent definitions, skills, per-agent persistent memory, settings. and in the same directory, the runtime churn: session transcripts, shell history, live credentials. if you only ever work on one machine this is a non-problem and you can stop reading.
i work on three. a work VM where most of the real work happens, the host workstation it runs on, and a secondary laptop. and here's the thing nobody warns you about: this is the dotfiles problem, the one we collectively solved fifteen years ago with a git repo and some symlinks, except now the files learn things. an agent on the VM spends an afternoon working out some gnarly corner of a system, which API endpoint lies, which service wants a flag nobody documents, and writes it into its persistent memory. the same agent on the host knows none of it. same agent. same definition, same name, same job. it just never got the memo, because the memo lives in a directory on a different machine. basic shit, sharing what one agent learned with the same agent somewhere else, turns out to be a hard problem, and the configs fork underneath you the whole time.
the thing that actually set me off: a dashboard-analysis agent that had only ever lived on the work VM. i wanted it on the host, because the host is where i can talk to it, voice input, no SSH hop in the middle. the definition is a file. copy a file, easy. except an agent without its memory is a new hire wearing the old hire's badge. everything it had learned about the dashboards, which panels lie, which datasource is the slow one, was in its memory directory, and that directory was about to fork into two divergent truths the second i copied it.
the naive fix is sitting right there: git init ~/.claude, push it somewhere, pull everywhere. it fails for two reasons. one obvious in hindsight, one obvious immediately.
the hindsight one: ~/.claude isn't a config directory, it's a live runtime directory that happens to contain config. sessions append, history churns, caches come and go. version that and every git status is a wall of noise, and noise is how you get hurt: you stop reading the wall, then one git add --all with a credentials file sitting in the tree and you've just pushed live tokens to a remote. not hypothetical. that's the blast radius of one lazy command.
the immediate one: the machines aren't equal and shouldn't be. the work VM carries work agents, work skills, work credentials. none of that has any business on a personal laptop. "sync everything" doesn't just sync state, it syncs liability, it dumps work secrets onto whichever machine pulls next. different machines want different subsets, and a bare git repo has no opinion about subsets.
so, the actual attempts, in the order i made them.
one: on the primary machine, the repo IS the directory. on the work VM the dotfiles repo is checked out as~/.claude, strict gitignore holding back the runtime churn, git-crypt on the secrets. works great. also only ever describes one machine's truth. single-player solution wearing a multiplayer haircut.
two: an install.sh that symlinks everything everywhere. the classic dotfiles move. clone on a new machine, run the script, every artifact gets a symlink. i wrote it, looked at it, and realized running it on the laptop would dump work credentials and a dozen work-only agents onto a personal machine in one keystroke. so install.sh got a refusal guard and a policy in its place: setting up a machine needs per-machine reasoning about what it should carry, and a blind script is structurally incapable of reasoning about anything. disabling your own installer feels like defeat. it isn't. cheapest correct decision in the whole story.
three: install-safe.sh, the universally-safe subset. if the full installer is banned, what's the largest set of links that's correct on every machine, no judgment required? turns out small but real: the repo-steward agent, the editor config. idempotent and non-destructive. it never clobbers; if a real file already sits at a target path it prints SKIP and moves on, and untangling that is explicitly a human's job. boring by design. boring is the feature.
four: the memory-dir symlink. this is the actual win. take the agent's persistent-memory directory in the live ~/.claude on the host and make it a symlink into the repo clone. now when the agent learns something at runtime, it's writing into the repo working tree. the repo becomes a sync bus: runtime learnings turn into commits, the other machine pulls, and the same agent over there wakes up knowing things it learned somewhere it's never been. the agent's instructions tell it to sync at session boundaries, and the sync itself is handed off to a repo-steward agent that owns the git mechanics: fetch, rebase, push, and a check that the encrypted blobs are actually ciphertext before anything leaves the machine. the agent that learns is not the agent that pushes. separation of duties, but for robots.
five: git-crypt for everything secret-shaped. secrets in the repo are ciphertext at rest, key carried out of band. a machine without the key can clone all day and hold nothing but noise. i applied this with more paranoia than strictly necessary: even archived voice-dictation transcripts get encrypted, on the theory that anything i said out loud near a microphone is not something i want grep-able on a forge.
six: the machine-profiles design doc. the endgame: classify every artifact in the repo, every agent, skill, memory dir, script, secret, as work, personal, or both, and drive installation from per-profile manifests keyed on a MACHINE_TYPE variable. and the rule i care about most: when MACHINE_TYPE is unset, fail closed. install nothing, rather than fall back to "everything", because "everything" is the original sin this whole thing exists to undo. status: designed, written down, argued with, not implemented. the document is real. the machinery is vaporware.
what actually worked: the memory symlink as sync bus. agent knowledge flows between machines now, which was the entire point. disabling the blind installer before it bit me. the idempotent safe subset. git-crypt. and, underrated, writing the work/personal classification down before building anything, because the table turned out to be the hard part and the installer is just the table made executable.
what still bites. the hand-copied agent files from the pre-symlink era are now actively in the way: the safe installer wants to lay a symlink where a real copied file sits, and, correctly, refuses to clobber it, prints SKIP, leaves the migration to me. my own past shortcuts are blocking their own replacement, and the same guard that protects me from the installer also protects the stale copies from getting fixed. the manifest engine is still a design doc. and the hard part is wide open: two machines writing to the same agent's memory at once is a distributed-writes merge problem, and my current "solution" is discipline, sync at session boundaries, rebase, don't run the same agent in two places at once. which is to say it's not a mechanism, it's a promise i make to myself. promises scale notoriously well.
lessons, for whatever they're worth:
copies drift, symlinks don't. every artifact i copied "just for now" became a divergent fork; every one i symlinked stayed true.
separate the portable layer from the runtime layer. the repo holds what should travel, the live directory holds what shouldn't. confuse the two and you get both the noise and the leaks.
fail closed on machine identity. an installer that doesn't know what machine it's on should do nothing, loudly.
encrypt secrets at rest, key out of band. then a clone is just a clone, not an incident.
write the classification down before you build the machinery. the doc caught design errors the script would have shipped.
the files learn things now. the least we can do is teach them to commute.
becoming the bootmgr: a four-round fight with HP firmware that ignores its own boot order
Dual-boot HP laptop. Windows 11 Pro and Ubuntu, UEFI mode. The symptom never moved the whole way through: reboot, and it goes straight into Windows, no GRUB menu, no chance to pick Ubuntu. What changed every round was why, and each round disproved the round before it. Took four to land on something that survives reboots in both directions, and the last one only worked after the third one bricked booting into Windows. This is the whole thing, start to finish, because the dead ends are the useful part.
Facts that hold the whole way through, so I stop repeating them: Secure Boot is OFF (Confirm-SecureBootUEFI → False), so this is not an SBAT/dbx shim revocation. Fast Startup is OFF (HiberbootEnabled = 0), so it's not a hybrid-shutdown skip. The ESP is Disk 0 Partition 1 (\Device\HarddiskVolume1; under Linux it's /dev/nvme0n1p1, a FAT volume with fs-uuid 36AB-DB35), and GRUB's files, shimx64.efi, grubx64.efi, mmx64.efi, the 117-byte grub.cfg stub, are all present and correct at \EFI\ubuntu\. GRUB was never the broken thing. The firmware boot policy was.
Round 1 (2026-06-13): the Ubuntu entry was simply gone
First look at the firmware boot manager (bcdedit /enum {fwbootmgr}): displayorder was just {bootmgr} (Windows) followed by a generic USB entry. no Ubuntu/GRUB entry in NVRAM at all, and timeout 0, so the firmware launched the first thing instantly. A Windows update had re-asserted Windows Boot Manager as the top entry and dropped the Ubuntu one entirely.
Fix: recreate the entry pointing at the shim and shove it to the front of the firmware order.
GRUB menu came back. Worked, confirmed. (The entry is a /copy of {bootmgr}, so it inherits a pile of irrelevant Windows-boot-manager sub-fields; for a firmware entry only device + path matter, the firmware just launches \EFI\ubuntu\shimx64.efi and the shim chainloads GRUB.) Then it reverted.
Round 2 (2026-06-14): the order was right, and it still booted Windows
Next time it broke, Windows again, but now the order was already correct. Ubuntu first, device pointing at the real ESP, shimx64.efi present. Nothing was "wrong" to re-fix. Secure Boot off, Fast Startup off, both ruled out. The likely trigger was a pair of security updates (KB5094126 / KB5094135) from a few days earlier, but the interesting part isn't the KB. It's that the firmware now showed the correct order and ignored it.
The decisive diagnostic for "is the firmware honoring NVRAM at all" is BootNext (a.k.a. bootsequence in bcdedit): a one-time EFI variable the firmware is contractually obliged to honor for exactly the next boot, independent of the regular order. Set it at Ubuntu, re-assert the order, reboot once.
The logic of the test: if GRUB appears, the entry is fine and the firmware just won't keep the persistent order, annoying but fixable. If it still boots Windows, the firmware is ignoring NVRAM entirely and every bcdedit reorder in the world is wasted motion.
Round 3 (2026-06-15): BootNext was consumed and it still booted Windows
This is the round that names the real problem. The one-time BootNext override was gone, consumed by a boot, and that boot landed in Windows anyway. Order correct, ESP intact, shim present, Secure Boot off, Fast Startup off, and the firmware had ignored a one-shot override aimed point-blank at Ubuntu.
Conclusion: This HP firmware does not honor the OS-set UEFI boot order. At all. It reads NVRAM when you write it, bcdedit reports success, then re-asserts its own policy on the next boot and launches the hardcoded Windows path regardless. Rounds 1 and 2 hadn't really "worked twice and reverted", they'd been coincidences. NVRAM reordering is a dead end on this box.
So stop fighting the order. The firmware always launches one path: \EFI\Microsoft\Boot\bootmgfw.efi. If you can't make the firmware point at GRUB, make that path be GRUB. Back up the real Windows boot manager, then overwrite it:
mountvol S: /S
copy S:\EFI\Microsoft\Boot\bootmgfw.efi  S:\EFI\Microsoft\Boot\bootmgfw.efi.bak  :: pristine, 3,055,616 B
copy S:\EFI\ubuntu\grubx64.efi           S:\EFI\Microsoft\Boot\bootmgfw.efi       :: now 2,828,168 B
Two things matter here. First, back up the genuine boot manager before you clobber it, verify it's actually a Microsoft PE binary and not an already-hijacked copy; don't trust a specific size, those shift across Windows builds. Second, and the part that trips people: overwrite with grubx64.efi, not shimx64.efi. Secure Boot is off, so the signed shim buys nothing here, and a shim dropped into the Microsoft directory would look for grub next to itself (in \EFI\Microsoft\Boot\) and fail. grubx64.efi carries its compiled-in /EFI/ubuntu prefix, so no matter what path the firmware launches it from, it still finds the grub.cfg stub. Reboot: firmware "boots Windows", gets GRUB, menu appears. Looked like victory.
Round 4 (2026-06-17): the hijack ate Windows
GRUB now appeared every time. But selecting "Windows Boot Manager" in the menu flashed once and dropped straight back to… the GRUB menu. Booting into Windows was now impossible.
The punchline:os-prober had generated GRUB's Windows menuentry to chainload /EFI/Microsoft/Boot/bootmgfw.efi, but that file is now GRUB itself. "Boot Windows" therefore meant "load /EFI/ubuntu/grub.cfg again" → same menu → loop, forever. We built the booby trap ourselves, back in Round 3. The generated entry looked like this, and the chainloader line is the whole bug:
The fast way to confirm "this file is not what its name says" is a byte-compare. Two files that should differ sharing an md5 means one clobbered the other:
The pristine backup from Round 3 is still sitting there (bootmgfw.efi.bak, 3,055,616 B, md5 895d6de079f42e848d87d59a937a4183), that's the real Windows manager. The resolution keeps the hijack (it's the only thing that makes GRUB appear on this firmware) but stops the chainloader from pointing at the lie. Three moves:
1. Give the real Windows manager a stable name of its own (leave .bak untouched as the archival copy):
3. Disable os-prober so the next update-grub doesn't helpfully regenerate the looping entry on top of mine. In /etc/default/grub:
GRUB_DISABLE_OS_PROBER=true
Then sudo update-grub. The resulting /boot/grub/grub.cfg has exactly two top-level menuentries, Ubuntu and Windows Boot Manager, and the only chainloader line in it points at bootmgfw_real.efi. The full chain now: firmware → \EFI\Microsoft\Boot\bootmgfw.efi (which is GRUB) → menu → pick Windows → chainload bootmgfw_real.efi (the real manager) → Windows. Both OSes boot, across real reboots, in both directions. Done.
Why this happens at all: Windows edits firmware boot order from userspace
The whole saga exists because a Windows Update can silently reorder your bootloader. It can because UEFI requires firmware to expose GetVariable/SetVariable Runtime Services that stay callable after boot, so BootOrder, Boot0000, BootNext all live in NVRAM as runtime-writable UEFI variables. Windows surfaces them through Get/SetFirmwareEnvironmentVariable, and bcdedit /set {fwbootmgr} … is just a front-end over that, gated behind SeSystemEnvironmentPrivilege (admin) and only in UEFI mode. Userspace tool, kernel-mediated, admin-only, and capable of dropping your GRUB entry on the next feature update. (Linux's equivalent is efibootmgr; same NVRAM, same power.) On most machines, putting Ubuntu first in that order is enough. This HP's firmware is the nastier case: it lets the OS write the order, reports success, then ignores it, so the only durable lever left is the one path the firmware can't route around.
The ongoing risk: this fix is not permanent
The hijack lives at a path Windows considers its own, which means Windows can take it back:
A Windows feature update or Startup Repair can rewrite \EFI\Microsoft\Boot\bootmgfw.efi back to the real manager, silently undoing the hijack → you boot straight to Windows again, no GRUB. If GRUB vanishes after a Windows update, this is why. Recovery is one line: sudo cp /boot/efi/EFI/ubuntu/grubx64.efi /boot/efi/EFI/Microsoft/Boot/bootmgfw.efi.
Windows servicing of Microsoft\Boot\ can also clobber or remove bootmgfw_real.efi. If GRUB shows up but Windows stops booting, re-copy it from the .bak.
If Secure Boot ever gets re-enabled, the unsigned grub sitting at the Microsoft path won't load, you'd have to switch to the signed shimx64.efi approach and place grub where shim expects to find it.
Takeaways
"Ubuntu is first in the boot order" is necessary, not sufficient. Some firmware shows you an order it has no intention of honoring.
BootNext is the single cleanest diagnostic: if a consumed one-time override still boots the wrong OS, the firmware is ignoring NVRAM entirely, stop editing it.
When firmware won't honor NVRAM, own the path it actually launches. The bootmgfw.efi hijack is a legitimate move, but it creates a trap: the file's name is now a lie, and any chainloader (os-prober, an update, future you) that points at it loops forever. Redirect Windows to a preserved copy and disable os-prober.
md5sum/byte-compare is the fast oracle for "did something overwrite this?". Two files that should differ sharing a hash is the tell.
None of this is permanent, it lives at a path Windows treats as its own, so a feature update can quietly take it back. The fix isn't "set it and forget it", it's "know the one-line recovery for when Windows reclaims its turf."
It's the free-space fragmentation, not the throughput: reproducing the ext4 block-allocator meltdown
The symptom
A near-full ext4 disk starts burning system CPU — not user, not iowait, kernel time. top shows a kworker/uNN:X+flush thread pinned near 100%, yet the disk is barely doing any I/O. Throughput is low. There's still free space. Nothing in the obvious metrics explains it.
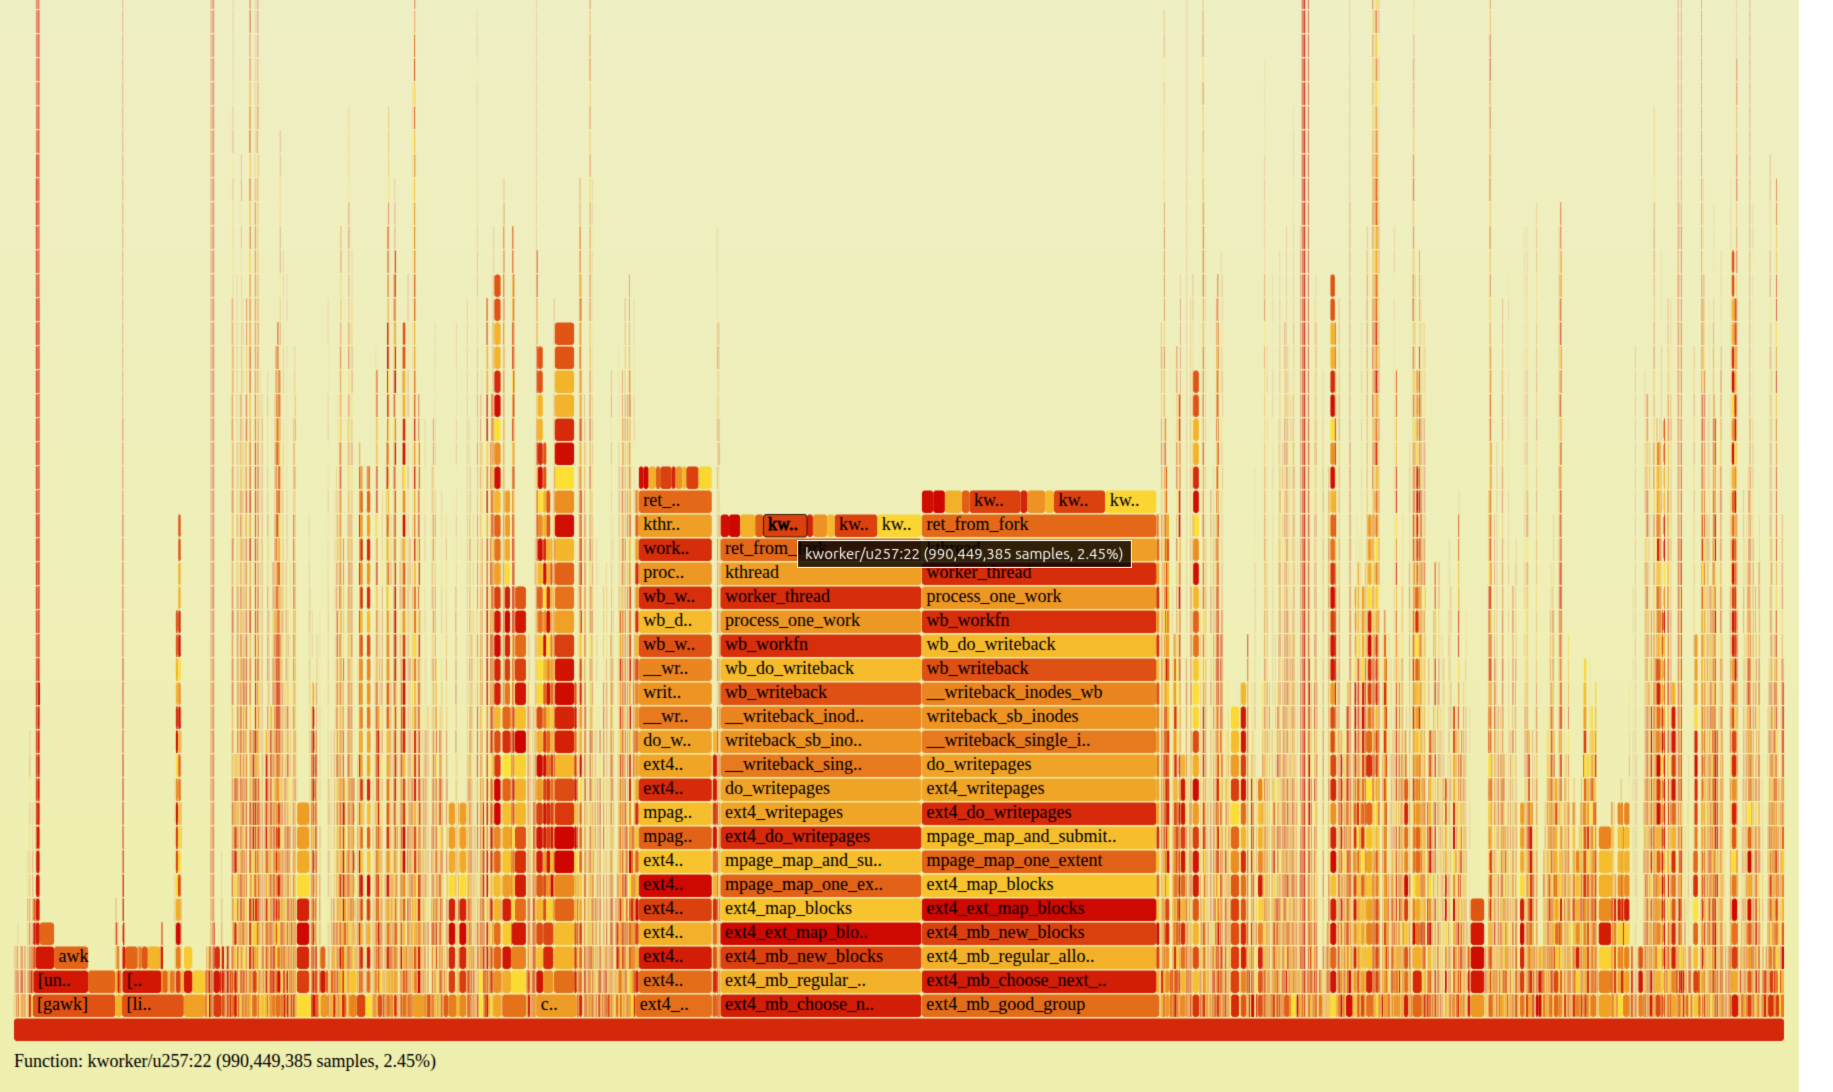
A CPU flamegraph of the flush kworker shows where the time goes:
Production writeback flamegraph: the kworker flush thread spends its time in ext4_writepages → ext4_map_blocks → ext4_ext_map_blocks → ext4_mb_new_blocks → ext4_mb_regular_allocator → ext4_mb_good_group
That bottom function — ext4_mb_good_group — is the ext4 multiblock allocator (mballoc) deciding whether a block group can satisfy an allocation. Near the top of a profile, it means the allocator is scanning block group after block group for free space, burning CPU. There's a well-documented public case at ahelpme.com ("degraded ext4 performance with millions of files because of high system time in ext4_mb_good_group"): ~20 million files, disk only ~80% full (≈20% free), high system time with minimal disk I/O. It melted despite having a fifth of the disk free — which already tells you fullness isn't the trigger.
What is? Three suspects get blamed, usually interchangeably:
Disk % full — "the disk is too full."
Throughput — "we're writing too hard."
File count — "there are too many files."
They travel together, so nobody separates them. Let's separate them.
Setup: an isolated, controllable ext4
Everything below runs against a throwaway loop-backed ext4 image, so no real disk is touched and state is fully controlled:
-i 4096 provisions one inode per 4 KB (~20M inodes on 80 GB). The default bytes-per-inode ratio would run out of inodes long before a million small files fit — and "millions of files" is the whole premise.
mb_optimize_scan=0 restores the old linear block-group scanner. Kernels since 5.18 default it ON; it keeps groups on ordered lists by largest free extent so the allocator jumps to a group that can actually satisfy the request instead of scanning linearly, which largely hides this pathology. Turning it off reproduces the pre-5.18 behavior.
stripe=384 makes the allocator attempt stripe-aligned allocation first (ext4_mb_scan_aligned) — relevant below.
Experiment 1 — same fill, same throughput, only fragmentation differs
Build two filesystems:
Fragmented: ~957,000 tiny (64 KB) files, then delete a scattered ~1/6. Free space is now ~64 KB holes scattered across every block group.
Control: ~366 large (200 MB) files, then delete a scattered handful. Free space is a few large contiguous 200 MB holes.
Both are filled to the same ~90%. Then run the identical workload against each: fio writing 1 MB files, rate-capped to the same 150 MB/s (buffered, so allocation happens in the flush kworker — the production path).
Same fill. Same throughput. The variable that moves is the free-space hole size: many small files shred free space into sub-request holes; few large files leave contiguous free.
metric
Fragmented (957k files)
Control (366 files)
ratio
fill
89%
90%
same
throughput (capped)
150 MB/s
150 MB/s
same
extents per 1 MB file
12.8
1.0
13×
ext4_mb_good_group calls
45,220,493
12,131
~3700×
ext4_mb_complex_scan_group
66,281
258
257×
allocation latency mode
256–512 µs
<128 µs
~2–4×
At identical fill and throughput, the fragmented filesystem called ext4_mb_good_group3,700 times more often. A 1 MB file that lands as one extent on the control shatters into ~13 fragments on the fragmented fs, because no single hole is big enough — so the allocator scans, splits, scans again.
A caveat about what "moved": the control is few large files, the fragmented fs is many small files, so file count and file size co-vary. What the experiment isolates is therefore free-space fragmentation (hole size < request size). File count is what produces that fragmentation — but the count alone isn't sufficient, which the next-to-last section makes explicit.
And a caveat about severity: in this realistic buffered, rate-capped run, the allocator was about 17.5% of the flush kworker's CPU — significant, but not yet a whole-machine meltdown. To make it dominate, take throughput out of the picture entirely.
Experiment 2 — decoupling from throughput entirely
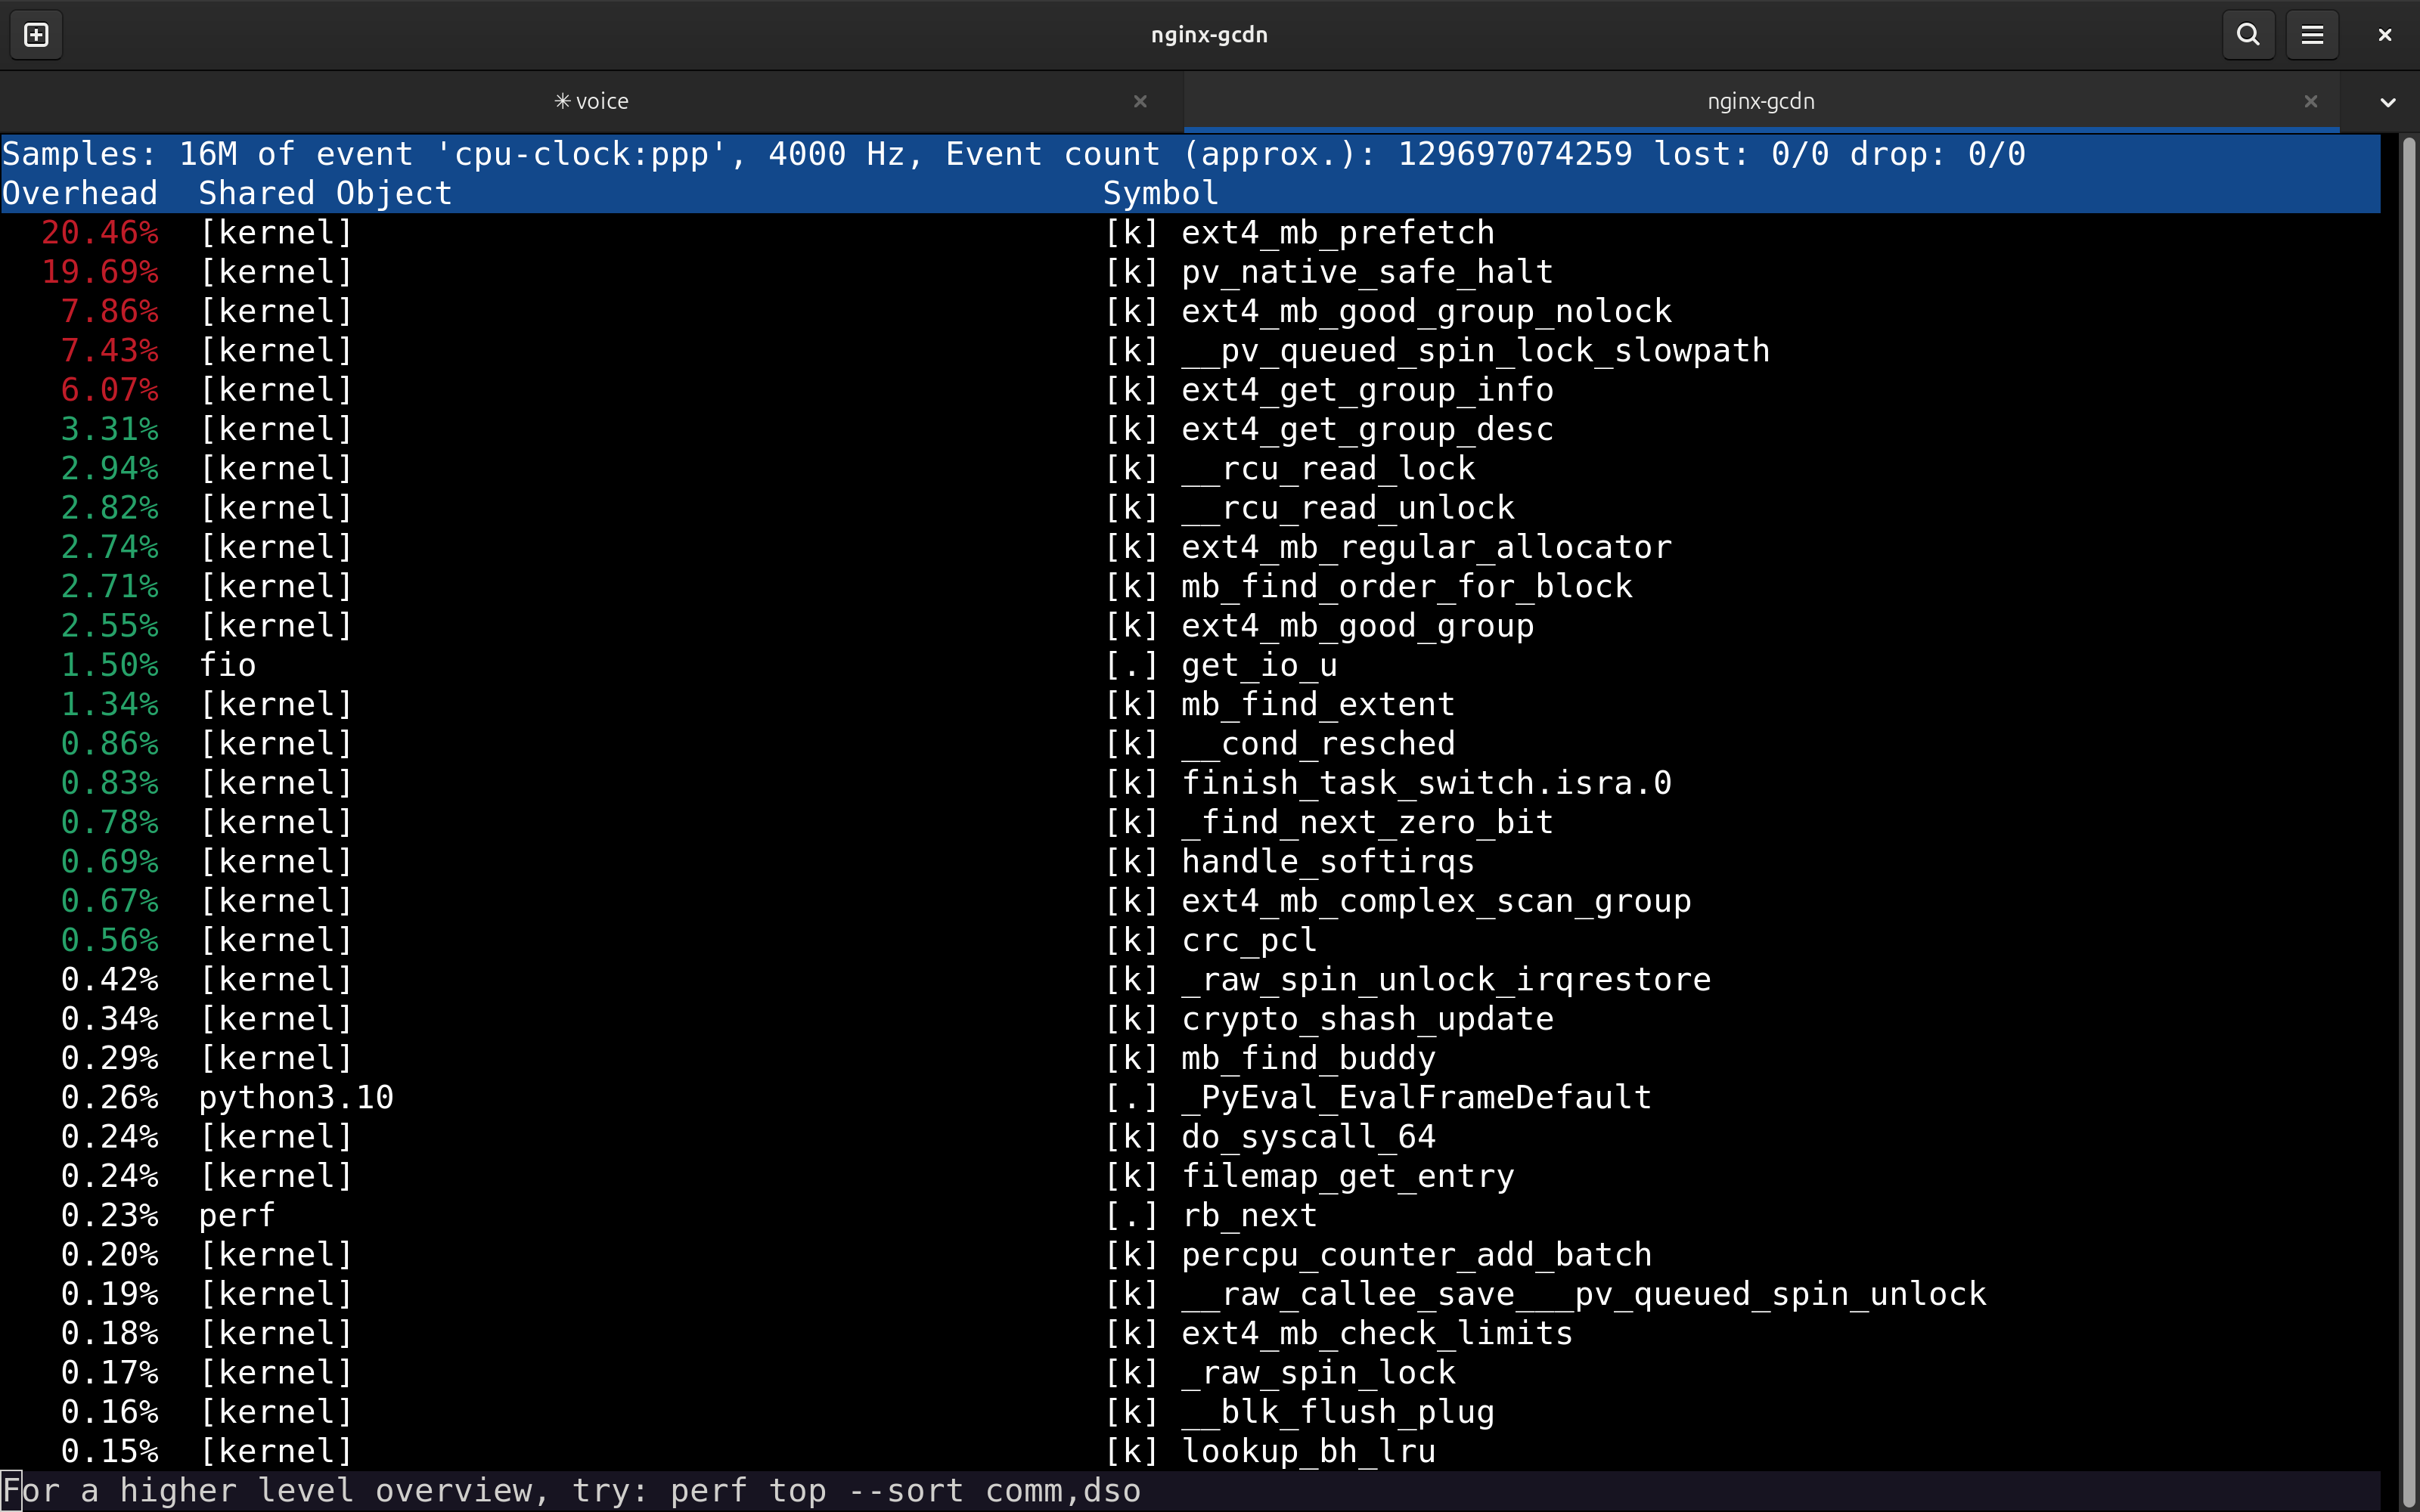
If throughput isn't the cause, can we peg the allocator CPU at zero throughput? Yes — with fio ioengine=falloc. A fallocate() runs the entire allocator path (ext4_mb_new_blocks → ext4_mb_regular_allocator → ext4_mb_good_group → ext4_mb_prefetch) but writes no data. Point 16 of them at the fragmented filesystem:
perf top of the falloc storm: ext4_mb_prefetch is the #1 function at 20.46%, above idle; ext4_mb_good_group_nolock, ext4_get_group_info, ext4_mb_regular_allocator, ext4_mb_good_group all follow
ext4_mb_prefetch sits at the top of perf top, above idle. vmstat reads sy=96 wa=0. Across a full profile the ext4 block allocator plus its lock contention is 58.5% of the machine (idle 21.6%), i.e. ~75% of all busy CPU. Data written to disk: ~0 MB/s.
This is a synthetic isolation, not a production workload — that's the point. falloc strips away the data so nothing but allocation remains, and the machine still goes to its knees. Throughput is not the cause; it's a casualty. In a real write path allocation becomes the bottleneck, so throughput collapses (which is exactly why the symptom is "low I/O, high system CPU").
Experiment 3 — what it looks like on a big machine
Run the same falloc storm on a 56-core box and the top of perf top changes character:
native_queued_spin_lock_slowpath dominates — and lower in the same profile sit ext4_get_group_info (10.9%) and ext4_mb_prefetch (6.2%). It isn't a different bug; the call graph shows the spin comes straight out of the allocator:
The lock is ext4_lock_group(), the per-block-group spinlock. With the linear scanner, all threads sweep the same low-numbered groups at once and pile onto the same locks. On many cores the fragmentation pathology shows up first as group-lock contention, with the scan functions underneath. The signature to recognize on real hardware: CPUs pinned in spin_lock_slowpath, not obviously "ext4" at a glance.
So what actually triggers it?
Necessary conditions, in order:
Free space fragmented into extents smaller than the allocation requests. The root cause, produced by many files + delete churn.
Requests bigger than the holes. If every allocation is 4 KB, even shredded free space satisfies instantly, no scan. This is why a filesystem full of tiny files doesn't necessarily trigger it — request size must exceed hole size. It's also why "it's just the number of files" is too glib: the count matters only because it produces sub-request holes.
A scanner that pays for fragmentation. This is where it splits into two regimes (below).
Amplifiers, not causes: high fill % (fewer groups have a large-enough free extent, so each scan runs further) — but recall the article melted at only ~80% full. Throughput is not a cause; it's an output.
Two regimes, two fixes
The same fragmentation bites through (at least) two different code paths, and they don't have the same fix:
Old linear scanner — pre-5.18 kernels, or any kernel with mb_optimize_scan=0. The allocator scans groups linearly via ext4_mb_good_group. This is the regime reproduced here, forced with mb_optimize_scan=0 (in these runs the stripe-aligned path barely fired — the cost was the linear group scan). Fix: mb_optimize_scan=1, the default since 5.18.
Stripe-aligned regression on 6.5+ — a newer-kernel regression in the striped-allocation path (kernel bug #217965, dirty writeout 50 s → 20 min). This is almost certainly what the ahelpme article hit, and its fix was a stripe=0 remount — which is exactly what that author reported worked. Note this regime happens withmb_optimize_scan on, so "just upgrade the kernel" is not the answer here.
Common to both regimes, and the thing you actually control: reduce the fragmentation — fewer / larger files, more free space, less delete churn.
Repro kit
The allocator storm is one fio job (this is the Experiment 2 config that produced the perf top above):
Run it in a loop (delete between passes so it doesn't fill), watch sudo perf top, and ext4_mb_prefetch climbs to the top — at zero MB/s of data. The other half is the fragmentation setup: fill to ENOSPC with 64 KB fallocate'd files, then delete a scattered 1/6 so the only free space left is 64 KB holes. Both halves are in the kit.
The lesson, if you take one: when an ext4 disk is burning system CPU with little I/O, don't reach for "it's too full" or "we're writing too hard." Look at free-space fragmentation and file count — and figure out which scanner regime you're in, because that decides the fix.